- The Product-Led Geek
- Posts
- 👓 Data Fluency: Why Some Product Teams Win While Others Flounder
👓 Data Fluency: Why Some Product Teams Win While Others Flounder
Ben Williams
March 25th, 2025
Welcome folks! 👋
This edition of The Product-Led Geek will take 8 minutes to read and you’ll learn:
The critical data challenges holding most teams back
The Data Fluency Matrix: A framework for levelling up
Practical next steps to strengthen your data foundation
Let’s go!

TOGETHER WITH INFLECTION.IO
Learn how Clay, Bill.com, Vercel, Mural, and Postman run product-activity based emails with Inflection.io
Did you know Inflection.io is the email platform behind modern PLG companies like Clay, Bill.com, Vercel, and Mural?
Inflection.io is the only marketing automation platform that lets you activate your CDP and data warehouse to drive more pipeline, product adoption, revenue expansion, and more.
Please support our sponsors!
GEEK LINKS
3 interesting, amusing, or enlightening links
1. Pressure
2. Dear Marketers, Should your founder be an influencer?
3. Growth at what cost? Balancing user experience and revenue
GEEK OUT
Data Fluency: Why Some Product Teams Win While Others Flounder
From early-stage startups to Fortune 500s, I see a clear pattern separating exceptional product leaders and their teams from the rest: their relationship with data.
The best product and growth teams wield data like a superpower.
They are fluent in data - in all its forms.
They make confident decisions, spot hidden opportunities, and course-correct with remarkable speed.
Meanwhile, most teams are flying half-blind, waiting weeks for basic insights and unable to prove their impact. Not because they don't value data, but because they lack the infrastructure, literacy, and culture to make it truly actionable.
The consequences of poor data capabilities are both tangible and costly.
Teams without data fluency frequently launch features no one wants, miss critical growth opportunities by failing to iterate quickly, waste engineering resources on low-value features, experience customer churn they can't diagnose, and struggle to prove their impact to the business.
I've seen these scenarios across companies of all sizes - from startups investing months into misguided features to enterprise teams maintaining zombie features that barely anyone uses.
The difference between success and failure often isn't team talent or effort, but rather their ability to leverage data effectively throughout the product lifecycle.
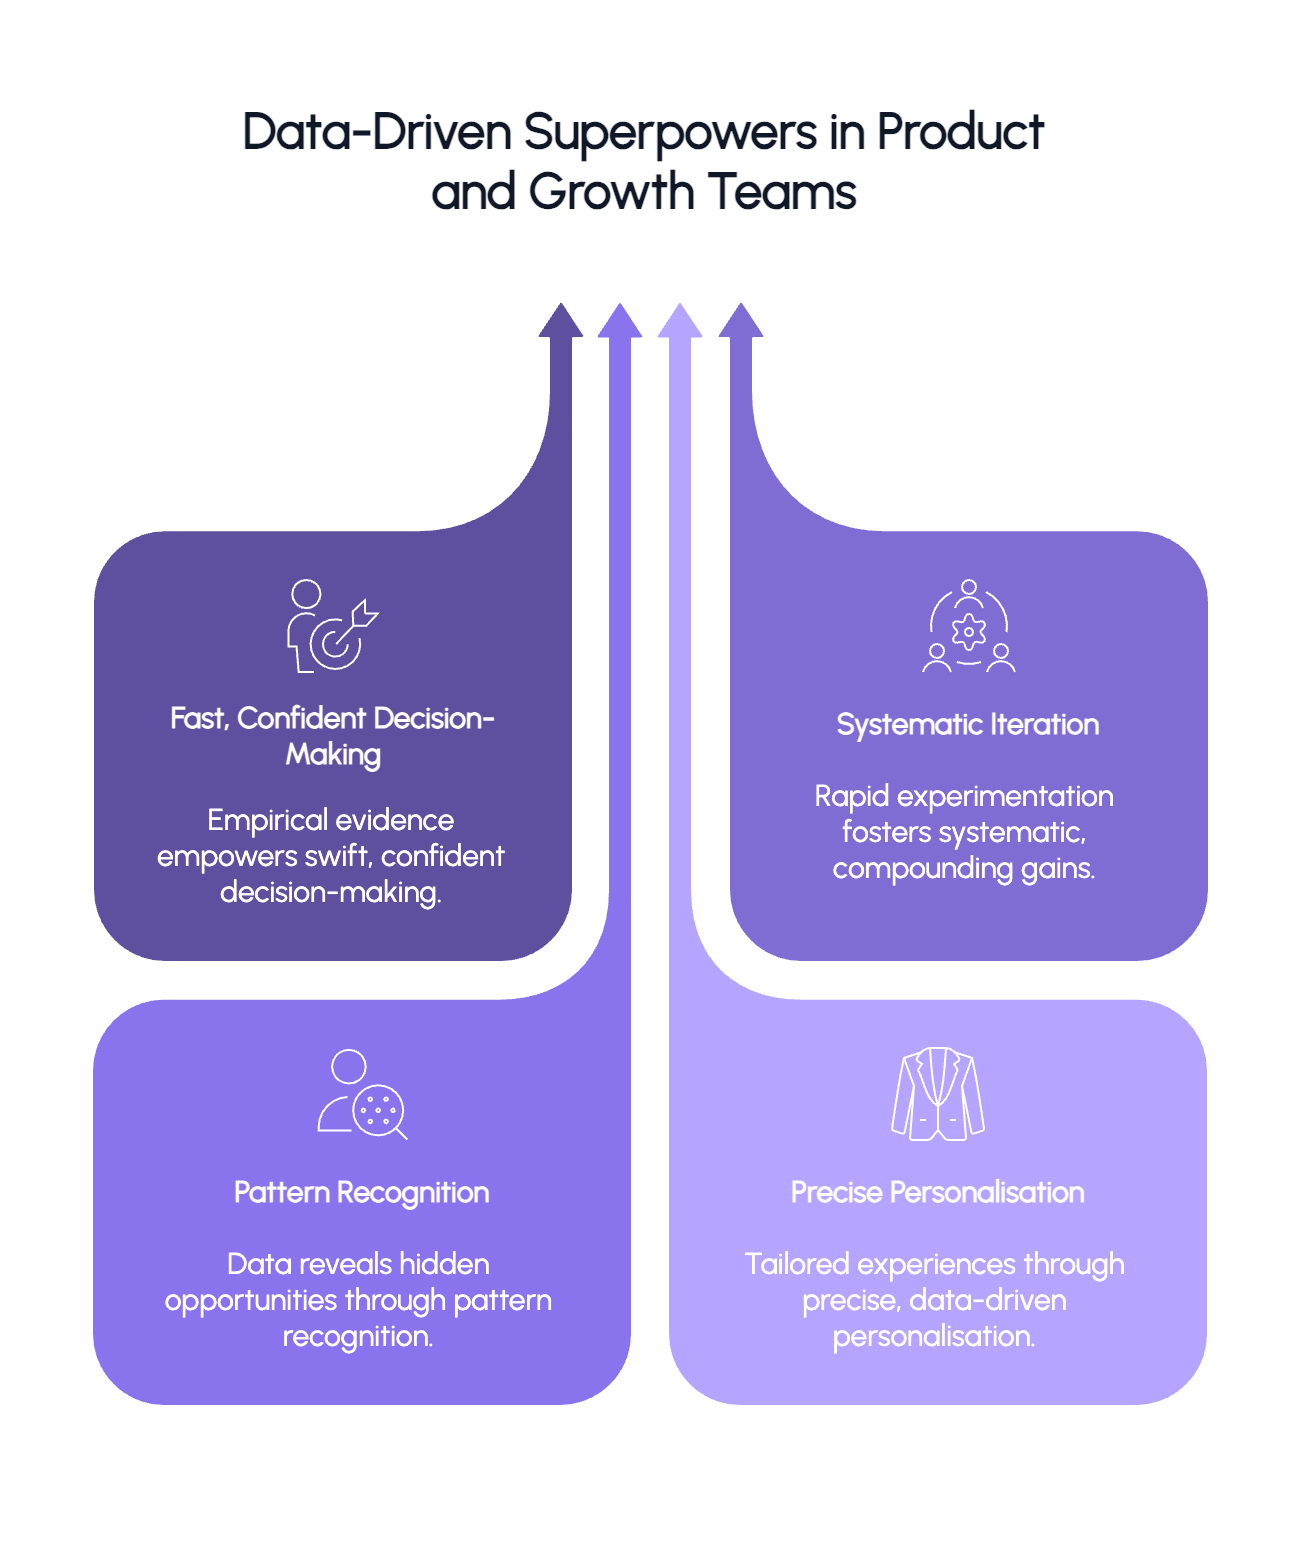
What Great Data Enables For Product & Growth Teams
Top class product and growth teams with access to quality data develop capabilities that transform how they operate. These are the superpowers that separate them from their peers:
1. Fast, confident decision-making
Great product teams use empirical evidence rather than opinions to make decisions.
Example: Microsoft's MSN team tested a homepage redesign incorporating more ads using controlled experiments on their Experimentation Platform (ExP):
A controlled experiment was run on 5% of the MSN US home page users for 12 days. Clickthrough rate decreased by 0.35% (relative change), and the result was statistically significant. Page views per user-day decreased 0.35%, again a result that was highly statistically significant. Translating the lost clicks to their monetary value, it was higher than the expected ad revenue. The idea of placing more ads was appropriately stopped.
2. Compounding gains through systematic iteration
Data-enabled teams build cultures of rapid experimentation where insights compound over time.
Example: Booking.com runs over 1,000 concurrent experiments at any given time, creating an infinite testing loop where winning ideas are broken into further micro-experiments to compound gains. This has helped them achieve conversion rates 2-3x the industry average, and hit $23B ARR and a market cap of ~$165B. They relentlessly iterate:
Form a hypothesis based on data (qual and quant)
Design an experiment to validate or disprove it
Implement winners, learn from all (win/lose/inconclusive)
Break winning ideas into more granular tests
3. Pattern recognition that uncovers hidden opportunities
Data reveals patterns that intuition alone would miss.
Example: At Snyk, we found that teams who fixed on 8+ unique days in the last 30 were twice as likely to still be active engaged teams in 12 months versus teams who fixed on between 1 and 3 unique days in the last 30.
See more on this here:

4. Precise personalisation
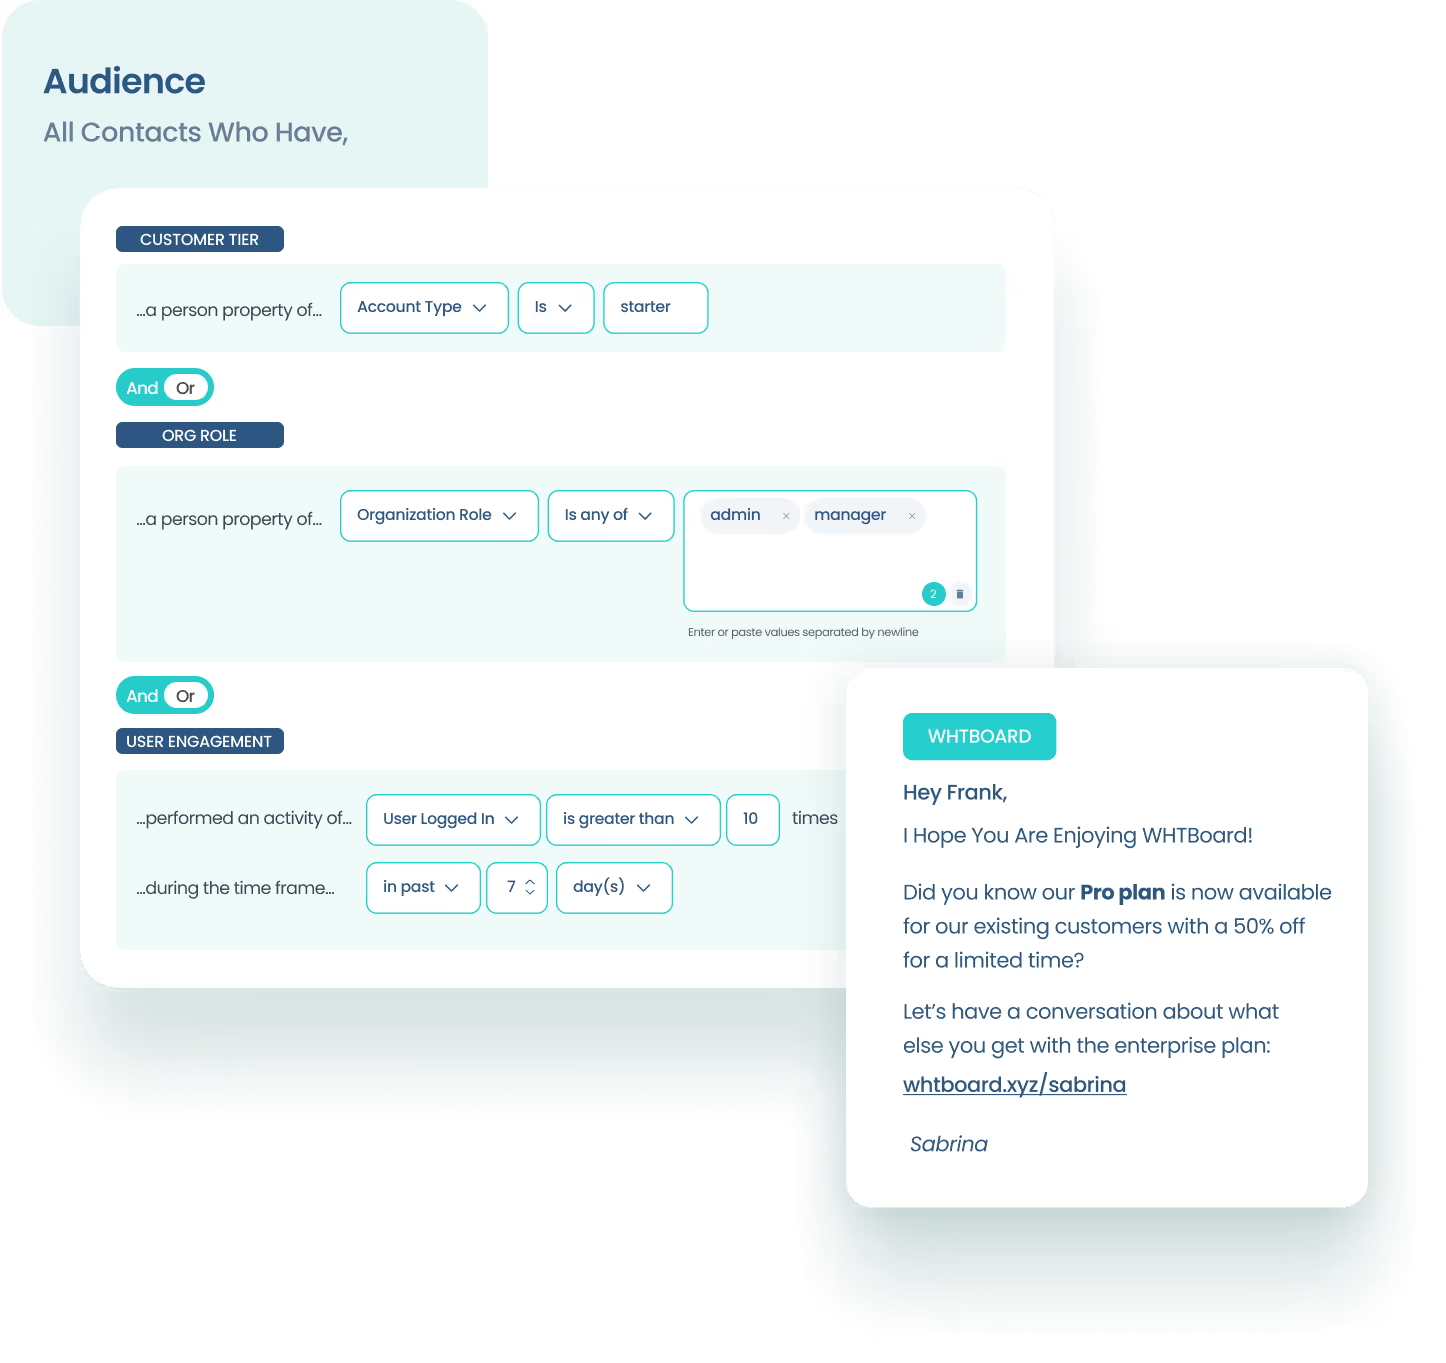
Data infrastructure enables delivering tailored experiences to different user segments automatically.
Example: Netflix's recommendation engine drives over 80% of content watched on the platform - a staggering figure that demonstrates the power of data-driven personalisation. By tracking viewing patterns across millions of users, they can suggest content that keeps viewers engaged far longer than a one-size-fits-all approach.
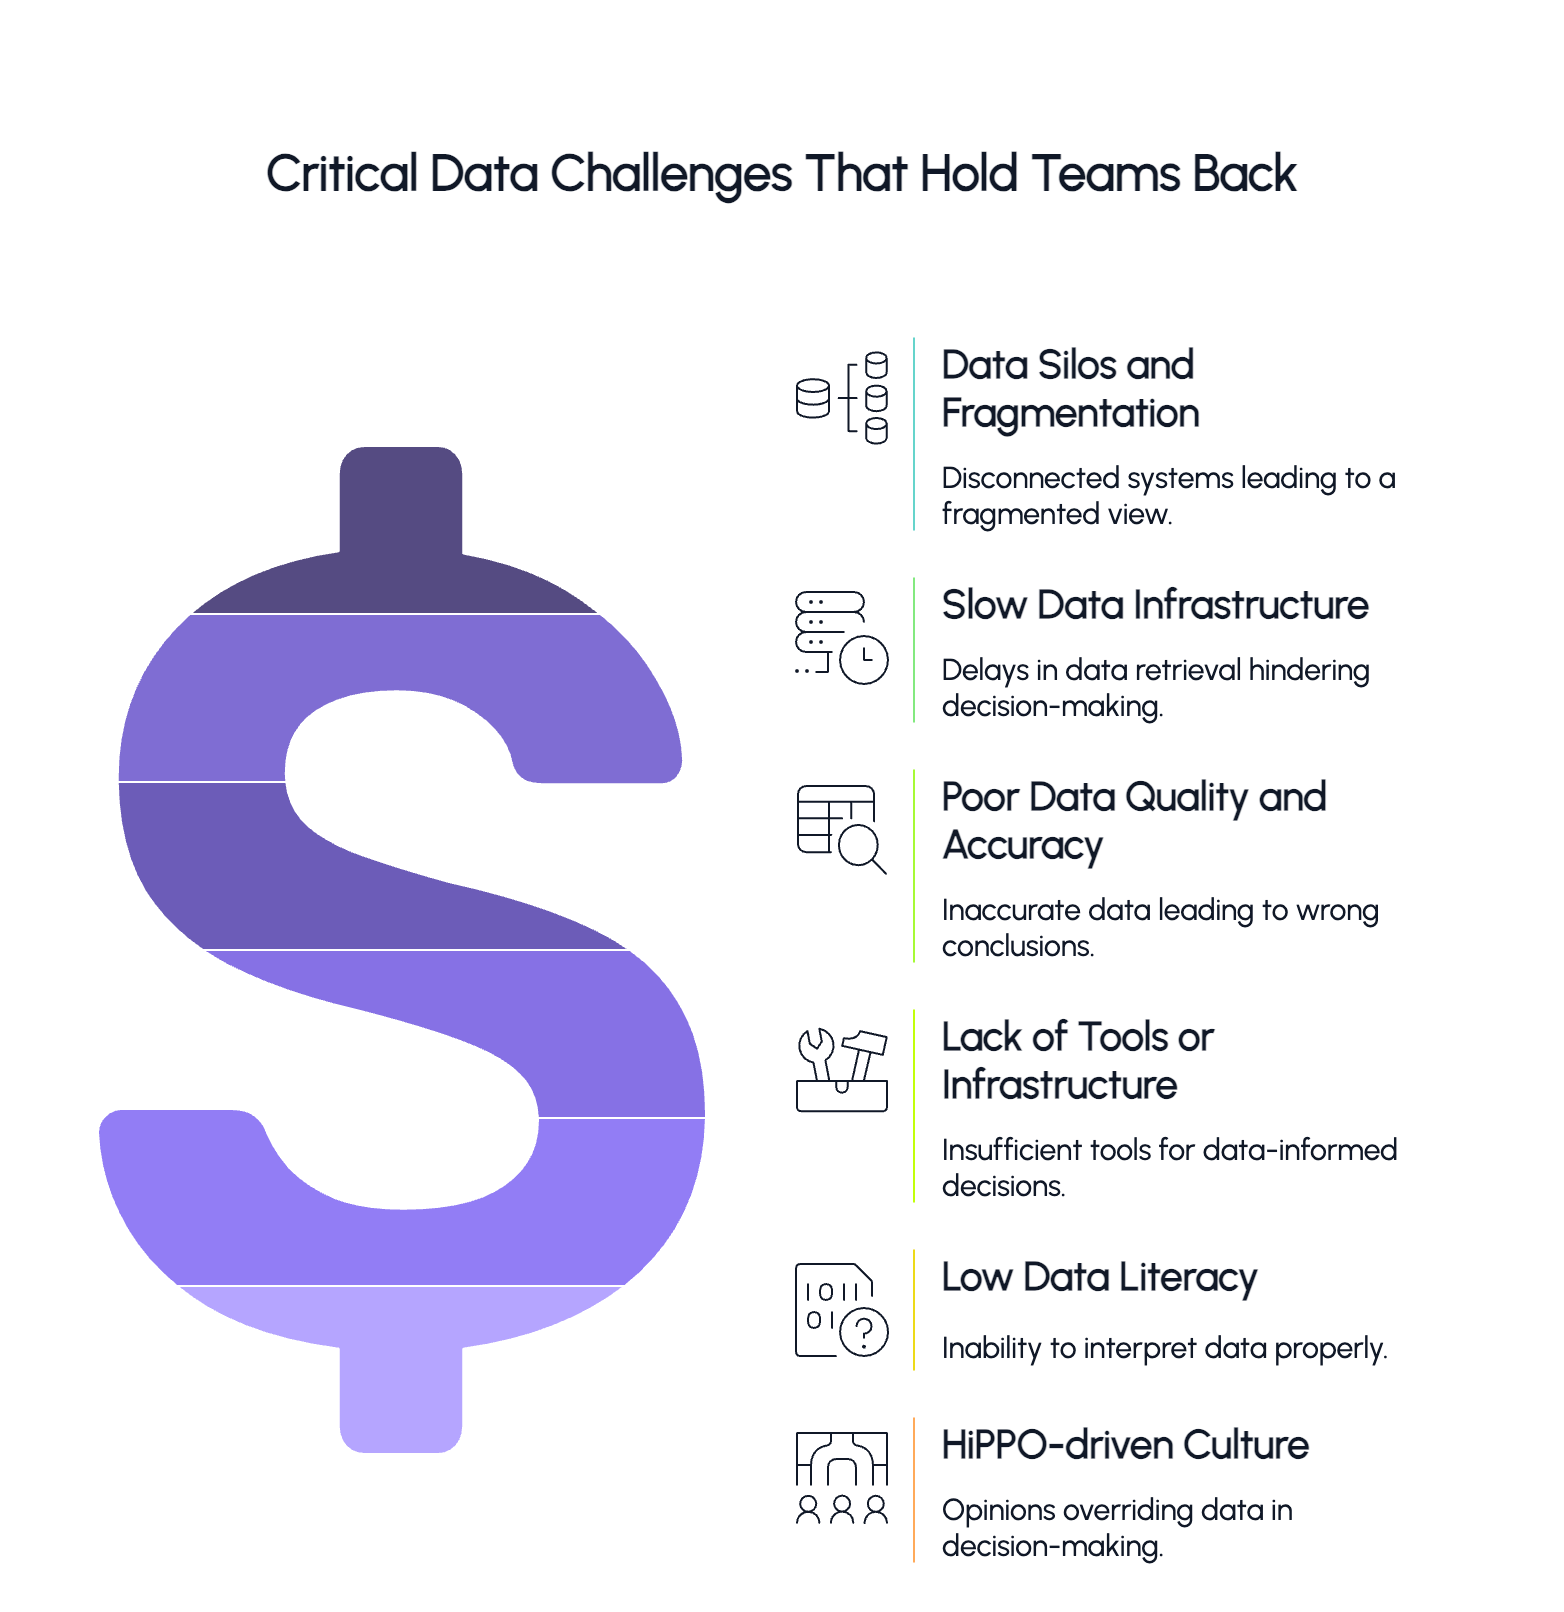
The Critical Data Challenges Holding Most Teams Back
Despite the clear advantages, most product and growth teams struggle to leverage data effectively. Here are the six most common challenges I've observed:
1. Data silos and fragmentation
When data lives in disconnected systems - analytics in one place, customer feedback in another, marketing metrics elsewhere - it creates a fragmented view of reality.
Impact: Teams can't connect behaviour to outcomes, struggle with attribution, and waste time arguing about whose numbers are correct.
2. Slow data infrastructure
Even when data exists, if retrieving it takes days or weeks, teams revert to gut decisions out of necessity.
Impact: Opportunities for quick wins are missed. Experiment cycles stretch from days to months. By the time insights arrive, the market has moved on or priorities have shifted.
Last year I did some work to audit a clients experiment process and discovered their average time from hypothesis to validated learning was 74 days. The breakdown was eye-opening for them:
5 days to get analytics tracking approved
12 days to implement tracking and validate it was working
21 days to run the experiment
36 days waiting for analysis from their overloaded data team
The missing ingredient was investment in fast, self-serve data infrastructure.
3. Poor data quality and accuracy
Garbage in, garbage out applies perfectly to product analytics. Inaccurate tracking or inconsistent definitions can lead to dangerously wrong conclusions.
Impact: Teams lose faith in the data and revert to opinion-based decisions. Worse, they might confidently make the wrong decisions based on flawed data, creating a false sense of being "data-driven."
A Gartner survey found organisations attribute an average of $12.9 million per year in losses to poor data quality problems - from missed sales opportunities to strategic missteps.
A product team I worked with had previously spent six weeks changing their onboarding flow based on conversion data that showed a big drop-off in a particular step. They made a bunch of changes to that part of the flow, then discovered their instrumentation was misreporting successful completions in places. This made step 3 appear to be the problem when users were actually dropping off much earlier. In that instance the work wasn’t completely wasted since the changes were net positive, but the biggest issue was still unresolved.
4. Lack of tools or proper infrastructure
Many teams lack fundamental tools needed for data-informed decisions: proper analytics platforms, experimentation frameworks, cohort analysis capabilities and so on.
Impact: Basic questions go unanswered and testing becomes manual and error-prone. I chatted to a founder just last week at a Series B startup with 50+ employees still using Google Analytics as their primary analytics tool. During our conversation, he said that GA had been their 'temporary solution' for almost two years and that in that time they’d built several big features with ‘disappointing adoption’. They’d likely missed numerous opportunities and wasted hundreds of thousands of dollars in engineering time because they couldn't see what users were actually doing. For those doing well with data, this may sound absurd - and it is - but it’s more common than you might think.
5. Low data literacy
Even with perfect tools, if teams can't interpret the data properly, it provides little value.
Impact: Vanity metrics get prioritised over actionable insights and correlation is confused with causation. A study by Qlik and Accenture found
92% of executives think data literacy is important, yet only 17% of companies actively encourage employees to improve these skills.
Only 21% of employees surveyed are fully confident in their data literacy skills (their ability to read, understand, question and work with data)
48% of employees frequently defer to making decisions based on gut feeling over data-driven insight.
6. HiPPO-driven culture (Highest Paid Person's Opinion)
When leadership values opinions over evidence, even the best data infrastructure won't drive good decisions.
Impact: Data becomes a checkbox exercise rather than a decision driver. Teams waste time gathering data that won't influence outcomes, and data-savvy professionals become frustrated and leave.
The Data Fluency Matrix: A Framework For Levelling Up Your Organisation
Given these challenges and consequences, how can product and growth leaders and their teams systematically improve their data capabilities?
I've developed a simple framework I call the Data Fluency Matrix that I use with companies to rapidly assess their data readiness, and help them plan to level-up.
This matrix evaluates organisations across two critical dimensions:
Data Infrastructure - The technical foundation that makes data collection, storage, and access possible
Data Culture - The human elements of skills, processes, and mindsets that determine how data is actually used

DATA DESERT (Low infrastructure, Low culture):
Intuition Dependent
Characteristics:
Data scattered across basic tools (spreadsheets, email)
No unified tracking or measurement framework
Decisions primarily driven by experience and opinion rather than data
Little awareness of what data could/should be tracked
DATA COLLECTORS (High infrastructure, Low culture):
Data Rich, Insight Poor
Characteristics:
Sophisticated tracking and tools in place
Dedicated data team or analysts
Little self-serve access for product/growth teams
Data rarely influences major decisions
Technical capabilities underutilised due to cultural barriers
Reports created but not acted upon
DATA STARVED (Low infrastructure, High culture):
Aspiration Constrained
Characteristics:
Strong appetite for data-informed decisions
Manual or cobbled-together analytics solutions
Strong data mindset limited by technical capabilities
Bottlenecks in accessing and processing data
High effort required for basic insights
Team regularly discusses available data despite limitations
DATA FLUENT (High infrastructure, High culture):
Empirically Guided
Characteristics:
Self-serve analytics accessible to all teams
Experiment-driven culture with clear frameworks
Decisions routinely informed by comprehensive qual and quant data
Data literacy widespread across roles
Insights regularly uncover non-obvious opportunities
🤔 Where in the matrix does your company sit?
Journey Through the Matrix
Most organisations start as DATA DESERTS - intuition dependent environments where gut feelings reign supreme - and should aim to become DATA FLUENT - empirically guided organisations where comprehensive data informs (not dictates) all major decisions.
However, the journey isn't always linear.
The Technology-First Trap: Organisations that focus exclusively on infrastructure without addressing culture become DATA COLLECTORS - data rich, insight poor organisations with expensive tools that go unused. These organisations have sophisticated dashboards that gather dust while opinions continue driving decisions.
The Enthusiasm Ceiling: Teams with strong data-driven aspirations but limited technical capabilities become DATA STARVED - aspiration constrained and passionate about data but burning out from the manual effort to gather basic insights.
The Diagonal Path: The most successful transformations take the diagonal path, advancing both technical infrastructure and data culture simultaneously:
Start with lightweight tools that deliver immediate value
Build cultural buy-in through early wins
Gradually expand technical capabilities as adoption increases
Connect data directly to business outcomes to address skepticism

Practical Next Steps On The Path To Data Fluency
Whatever your current position in the matrix, here are concrete actions product and growth leaders and their teams can take to improve their data capabilities:
For improving Data Infrastructure:
1. Conduct a data audit
Map where all your user and product data currently lives
Identify the biggest gaps and inconsistencies
Document the current process (and time required) for common data requests
2. Establish a core tracking plan
Define the essential user actions and properties to track
Create a standard naming convention for events and properties
Document the business meaning of each metric
3. Implement the right tools for your stage
Early stage: Focus on simple, flexible analytics (PostHog, Amplitude, Mixpanel, etc.)
Growth stage: Add A/B testing and experimentation tools
Scale stage: Invest in data warehouse and custom tooling
4. Build connectors between systems
Connect product analytics with marketing attribution data
Link customer feedback to user profiles and behaviours
Ensure finance and product teams work from the same numbers
5. Create self-serve capabilities
Build dashboards for frequently asked questions
Enable non-technical team members to explore data
Establish service-level agreements for custom data requests
For improving Data Culture:
1. Start with leadership alignment
Explicitly value data in decision frameworks
Model data-informed decision making
Celebrate learnings from experiments, even failed ones
2. Build basic data literacy
Train teams on analytics tools and basic statistics
Create a data champion role on each team
Establish a regular data learning forum
3. Implement a testing framework
Define hypothesis formats and success criteria templates
Establish minimum sample sizes and statistical significance standards
Create a log of all tests and their outcomes for institutional knowledge
4. Connect data to outcomes
For every initiative, explicitly state which metrics it should influence
Review actual impact against predictions
Tie team incentives to data-backed outcomes, not just shipping features
5. Make data visible and accessible
Display key metrics prominently in workspaces
Start meetings by reviewing relevant data
Create a culture of "show me the data" for all assertions
Conclusion: The Unfair Advantage of Data-Enabled Teams
The performance gap between data-fluent teams and their counterparts is almost always structural, not incidental.
Market leaders don't necessarily employ smarter people - they've established systems that enhance collective intelligence through empirical feedback.
While most organisations navigate by consensus and intuition, data-fluent teams build institutional knowledge that compounds with each decision cycle, creating an increasingly precise understanding of what actually works.
Data-fluent teams:
See patterns others miss
Learn 5-10x faster through systematic experimentation (see the Learning Velocity Index)
Make decisions with empirical confidence rather than political consensus
Allocate resources to what demonstrably works
Measure actual impact rather than perceived value
This creates a compounding advantage where each data-informed decision builds on the last, creating an ever-widening gap between these companies and their competitors.
The journey from Data Desert to Data Fluent isn't easy, but each step delivers immediate value.
Start by honestly assessing where your organisation sits on the Data Fluency Matrix, then identify your single biggest opportunity for improvement.
For some, that means investing in basic infrastructure. For others, it means changing how decisions are made.
But for all product and growth teams, it means acknowledging a simple truth: your relationship with data is a primary determinant of success or failure.
Enjoying this content? Subscribe to get every post direct to your inbox!
THAT’S A WRAP
Before you go, here are 3 ways I can help:
Take the FREE Learning Velocity Index assessment - Discover how your team's ability to learn and leverage learnings stacks up in the product-led world. Takes 2 minutes and you get free advice.
Book a free 1:1 consultation call with me - I keep a handful of slots open each week for founders and product growth leaders to explore working together and get some free advice along the way. Book a call.
Sponsor this newsletter - Reach over 7600 founders, leaders and operators working in product and growth at some of the world’s best tech companies including Paypal, Adobe, Canva, Miro, Amplitude, Google, Meta, Tailscale, Twilio and Salesforce.
That’s all for today,
If there are any product, growth or leadership topics that you’d like me to write about, just hit reply to this email or leave a comment and let me know!
And if you enjoyed this post, consider upgrading to a VIG Membership to get the full Product-Led Geek experience and access to every post in the archive including all guides.
Until next time!
— Ben
RATE THIS POST (1 CLICK - DON'T BE SHY!)Your feedback helps me improve my content |
PS: Thanks again to our sponsor: Inflection.io
Reply