⏰ Updated 2025-03-27
Good morning folks! In today’s PLGeek:
📅 GEEKS OF THE WEEK: 5 links for you to bookmark
🧠 GEEK OUT: How to write a great experiment plan
📝 GEEK TEMPLATE: My go-to experiment plan template (Notion)
😂 GEEK GIGGLE: 1 thing that made me laugh this week.
Total reading time: 8 minutes
Let’s go!
Upload customer interviews, research papers, support tickets, NPS responses - all your qualitative data into Dovetail and use Magic search to get quick clarity on your next big decision.
Magic search can:
Understand the meaning behind questions
Retrieve supporting data
Summarize everything in a shareable video highlight reel
Get access to Magic search and all Dovetail’s AI features on our Professional plan. Available today for Product-Led Geek subscribers for an exclusive extended 30-day trial.
Please support our sponsors!
Enjoying this content? Subscribe to get every post direct to your inbox!
📅 GEEKS OF THE WEEK
5 bookmark-worthy links:
🧠 GEEK OUT
How to write a great experiment plan
Well-crafted experiment plan are more than just documents - they’re the foundation of successful testing programs.
They guide you through the process of testing hypotheses and driving meaningful improvements in your product.
A great experiment plan template sets a high bar for product and growth teams to uphold the growth process and minimises the risk of costly experiment planning and execution errors.
In this post, I’m going to share the experiment plan template that I’ve used and evolved over my time as a product and growth leader, including most recently at Snyk, as well as with many of the companies I’ve advised.
I’ll go through my template section by section and break it all down for you.

But before we get going, ask yourselves - “Do we really need an experiment for this?”
There are several reasons than an experiment might not make sense:
We have such high confidence in doing something that just moving forward with the implementation/scaling of an idea is low risk.
We don’t have enough traffic to this product surface area to make it feasible to run an experiment within a timeframe we feel is acceptable for learning
The questions we're trying to answer more 'why?' than 'what?'
We don’t have a well-informed and well-formed hypothesis.
For more on that take a look at the post below:
Assuming you determine an experiment is the right way forward…..Let’s dig in…
1. Summary & Learning Objective
Start with a clear, concise description of your experiment. Here's a simple format to follow:
We want to [Change X] for [User Group U].
We hope to improve [Metric Y], and do no harm to [Metric Z].
When this experiment concludes, we hope to have learnt [Learning objective]
Why it's important: This section sets the stage for your entire experiment, providing a quick overview for stakeholders and team members. It's crucial because it:
Aligns everyone on the experiment's purpose and scope
Clearly states what you're trying to achieve and learn
Helps in quick decision-making by highlighting the key metrics you're focusing on
Sets expectations for the experiment's outcome
A well-defined summary and learning objective helps you stay focused throughout the experiment process and makes it easier to communicate your intentions to the wider team.
2. Hypothesis
Your hypothesis is the backbone of your experiment. It should be grounded in prior data, not just opinions. Use this format:
Null Hypothesis (H₀):
[Change X] will have no effect on [primary metric Y].
Alternative Hypothesis (H₁):
Because [evidence/observation],
We believe that [change X],
Will result in [expected direction and magnitude of change] to [primary metric Y].
Why it's important: A strong hypothesis is critical because it:
Forces you to articulate your assumptions clearly
Helps people understand the ‘why’ behind the experiment
Ensures your experiment is based on evidence, not just hunches
Provides a clear prediction that you can test against
Aligns with proper scientific testing methodology
Reminds us that we're gathering evidence against the null hypothesis, not directly "proving" our alternative hypothesis
Remember, great hypotheses are evidence-based. Link to research collections, analytics charts, or other supporting evidence. Think about your evidence in two parts:
The observation of the current situation (e.g. only 1.8% of users on this screen click the CTA), and
Why you think the test experience will change the observed situation (e.g. user research suggests that the CTA is not noticed, and a competing CTA that is more prominent is clicked by 16.4% of users)
In my experience, hypotheses that are grounded in solid evidence lead to accelerated learning.
Example:
Null Hypothesis (H₀):
Changing the location of the signup CTA will have no effect on signup conversion rate.
Alternative Hypothesis (H₁):
Because 98.2% of visitors to the homepage do not click on the CTA to sign up, and a competing CTA to book a demo is clicked by 16.4% of users, and recent observational studies suggest the signup CTA is rarely noticed,
We believe that changing the location of the signup CTA to make it more prominently visible,
Will result in more visitors seeing and interacting with the CTA, increasing signup conversion rate from 1.8% to 10%.
3. Evidence
Elaborate on the evidence supporting your hypothesis. This might include analytics charts, session replays, user interview recordings, competitive analysis, or other market research.
Why it's important: The evidence section is crucial because it:
Validates the basis of your experiment
Provides context for your hypothesis
Helps others understand your reasoning
Can highlight potential areas of post experiment investigation to better understand the reasons behind a given outcome
The more comprehensive your evidence, the stronger your experiment foundation. I’ve seen time and time again that experiments with well-documented evidence are more likely to gain stakeholder buy-in and lead to meaningful product improvements.
4. Experience
This is the part where you describe how users will experience the experiment.
Clearly define both the control and test groups:
Control Group: Summarise what the control group will experience. Include screenshots/designs
Test Group: Detail the experience for the test/treatment group. Again, screens are a must.
Why it's important: Clearly defining the experience is critical because it:
Ensures everyone understands exactly what is being tested
Helps identify potential confounding variables
Provides a clear visual aid for implementation
Aids in interpreting the results by clearly showing what changed
Detailed descriptions of the control and test experiences help bring the test to life.
5. Targeting
Create a table outlining the following parameters:
Where: Which product surface will host the experiment?
Who: Which users will see the experiment?
When: When will those users see the experiment? To avoid bias in the experiment, this should be the very last moment before the user experience diverges for control and test group, i.e. when each set of users is bucketed in code.
How: How will traffic be split between test groups?
Why it's important: Precise targeting is crucial because it:
Ensures you're testing with the right audience
Helps control for variables that might skew your results
Allows for more accurate interpretation of results
Can highlight segment-specific insights
Well-defined targeting is essential to the integrity of your experiment.
6. Metrics
Clearly define the metrics that are relevant to your experiment.
Primary Success Metric: This is the ONE metric explicitly stated in our null and alternative hypotheses. The formal statistical outcome of the experiment (reject or fail to reject H₀) is determined solely by this metric.
Guardrail Metrics: These metrics are also analysed for statistical significance, but separate from the primary hypothesis test. A statistically significant negative impact on any guardrail metric may lead us to decide against implementation, even if we successfully reject the null hypothesis for our primary metric.
Monitoring Metrics: These provide additional context but won't determine the experiment outcome.
Why it's important: This metrics framework is essential because it:
Provides clear success criteria for your experiment
Helps you understand the full impact of your changes
Allows you to catch any unintended consequences
Enables informed decision making
Distinguishes between statistical significance and business decision-making
Having this clear separation of metrics helps you make more balanced decisions about implementing changes post-experiment.
7. Statistical Design
This section is crucial for ensuring your experiment's validity. Include:
Baseline Data:
Primary Metric Baseline with time period
Standard Deviation (for continuous metrics)
Observed Patterns (weekly/daily variations)
Historical Context
Daily Traffic
Statistical Design:
Statistical Power (e.g., 80%)
Significance Level (e.g., 5%)
Minimum Detectable Effect (MDE)
Required Sample Size
Required and Target Runtime
We follow the standard scientific approach of assuming the null hypothesis (H₀: no effect exists) and then determining whether the evidence allows us to reject this assumption.
Our decision rule:
If p < [significance level] for our primary metric: We reject the null hypothesis and conclude that our change likely has a real effect
If p ≥ [significance level] for our primary metric: We fail to reject the null hypothesis, meaning we don't have sufficient evidence that our change has an effect
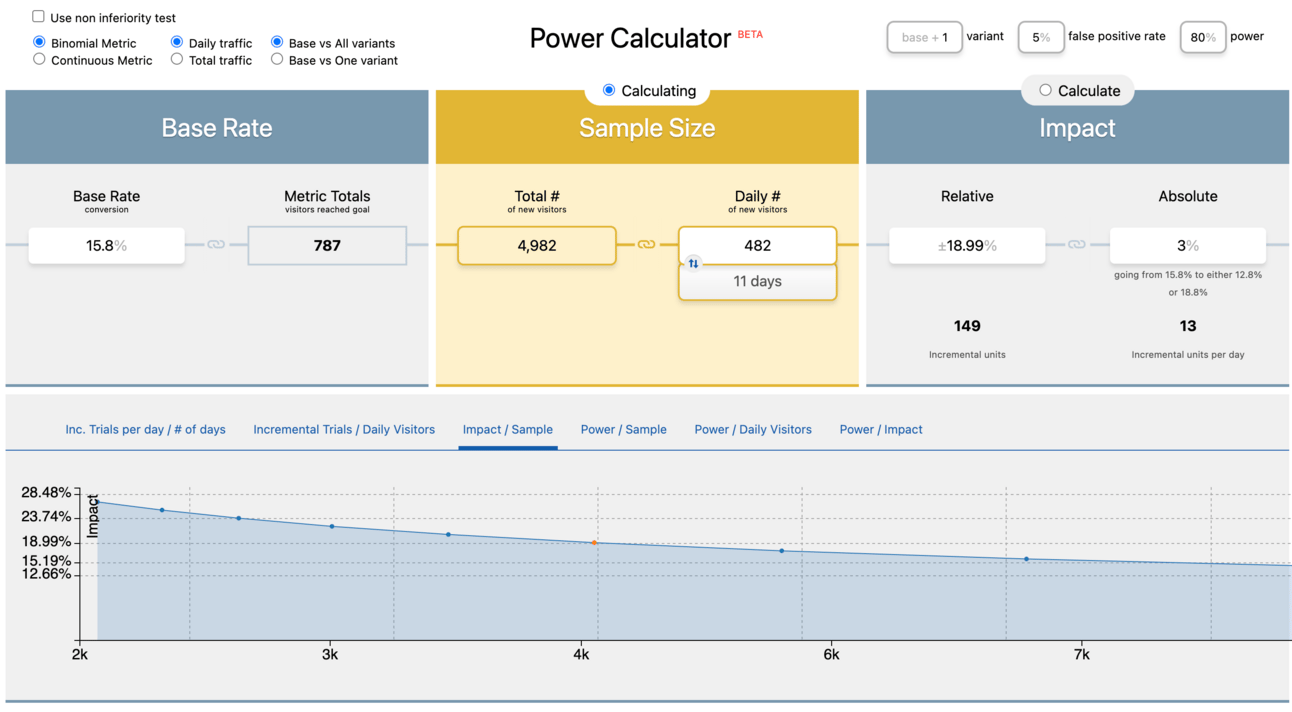
Use a statistical design tool (example) to help determine these parameters.

Why it's important: Robust statistical design and baseline analysis are the foundation of any valid experiment because they:
Help you determine how long to run your experiment
Ensure you have realistic expectations for improvement
Allow you to detect meaningful changes in your metrics
Ensure you know when your results are statistically significant and not due to chance
Allow you to identify any abnormalities during the experiment
Increase wider confidence in your experiment results
If you don't get this right, you're very likely to be misled by data.
8. Decision Framework & Action Plan
Outline your plan for various outcomes:
Based on our statistical outcome, we will take one of the following actions:
If we reject H₀ AND guardrail metrics are unharmed:
Implement the winning variant
Document learnings and extend to similar product areas
Consider follow-up experiments to optimise further
If we reject H₀ BUT one or more guardrail metrics are harmed:
Do not implement
Analyse the trade-off between primary benefit and guardrail harm
Consider redesigning the solution
Document learnings
If we fail to reject H₀ with adequate sample size:
Do not implement the change
Examine segment data for potential effects
Consider iteration on the design
Document learnings
If we fail to reject H₀ with inadequate sample size:
Extend experiment or redesign with larger sample
Document learnings
If results show negative effect:
Do not implement
Document learnings about why the approach didn't work
Plus a stakeholder communication plan: Who needs to know the results, when, how, and what key messages to communicate.
Why it's important: A clear decision framework and action plan are vital because they:
Prepare you for all possible outcomes
Speed up decision-making post-experiment
Ensure you've thought through the implications of your results
Help align stakeholders on next steps before you even start
Distinguish between statistical outcomes and business decisions
Having this predetermined framework helps you move quickly from experiment results to implementation, significantly improving your product iteration speed.
9. Results
After running your experiment, document the outcome in these key sections:
Statistical Outcome:
Primary Metric Result for control and treatment
Absolute and Relative Difference
p-value and Confidence Interval
Statistical Decision (Reject H₀ / Fail to reject H₀)
Experimental Validity:
Was the experiment properly powered?
Were there any external factors or technical issues?
Interpretation:
What does this outcome tell us about our original hypothesis?
How should we interpret the practical significance of the effect size?
What are the limitations of this experiment?
What unexpected insights emerged from the data?
Note: Remember that a statistically significant result (p < 0.05) does not "prove" our alternative hypothesis—it provides evidence against the null hypothesis of no effect. Similarly, failing to reject the null hypothesis does not prove that no effect exists.
Why it's important: Thorough documentation of results is crucial because it:
Creates a record of what was learned
Helps inform future experiments and product decisions
Allows for knowledge sharing across the organisation
Provides accountability for the experiment process
Avoids common misinterpretations of statistical results
To avoid common misconceptions:
✅ DO say: "We have statistically significant evidence that the change affects [metric]."
❌ DON'T say: "We've proven our hypothesis."
✅ DO say: "We did not find statistically significant evidence of an effect."
❌ DON'T say: "We proved there is no effect."
✅ DO say: "If there truly were no effect, seeing results this extreme would be unlikely (p = X)."
❌ DON'T say: "There's a (1-p)% chance that our feature works."
✅ DO consider both statistical significance AND practical significance (effect size).
❌ DON'T focus solely on p-values without considering the magnitude of the effect.
Well-documented experiment results become a valuable resource, informing product and growth strategy and helping you avoid repeating unsuccessful experiments.
Bringing it all together
By following this structure and understanding the importance of each section, you'll create comprehensive, actionable experiment plans where each component plays an important role in ensuring your experiments are well-designed, executed, and leveraged for maximum impact.
Remember, the key to successful experimentation is rigour and clarity. Each section should be well-thought-out and clearly communicated. This not only helps your team execute the experiment effectively but also makes it easier to learn from the results and apply those learnings to future experiments.
In my time at Snyk, well-documented experiments were instrumental to our process of driving improvements to our growth metrics. They allowed us to make better decisions and continuously improve our product experience. As an additional benefit, they created a culture of experimentation where team members felt empowered to test their ideas and contribute to the product's growth.
Get this foundational discipline right and you’re half way there.
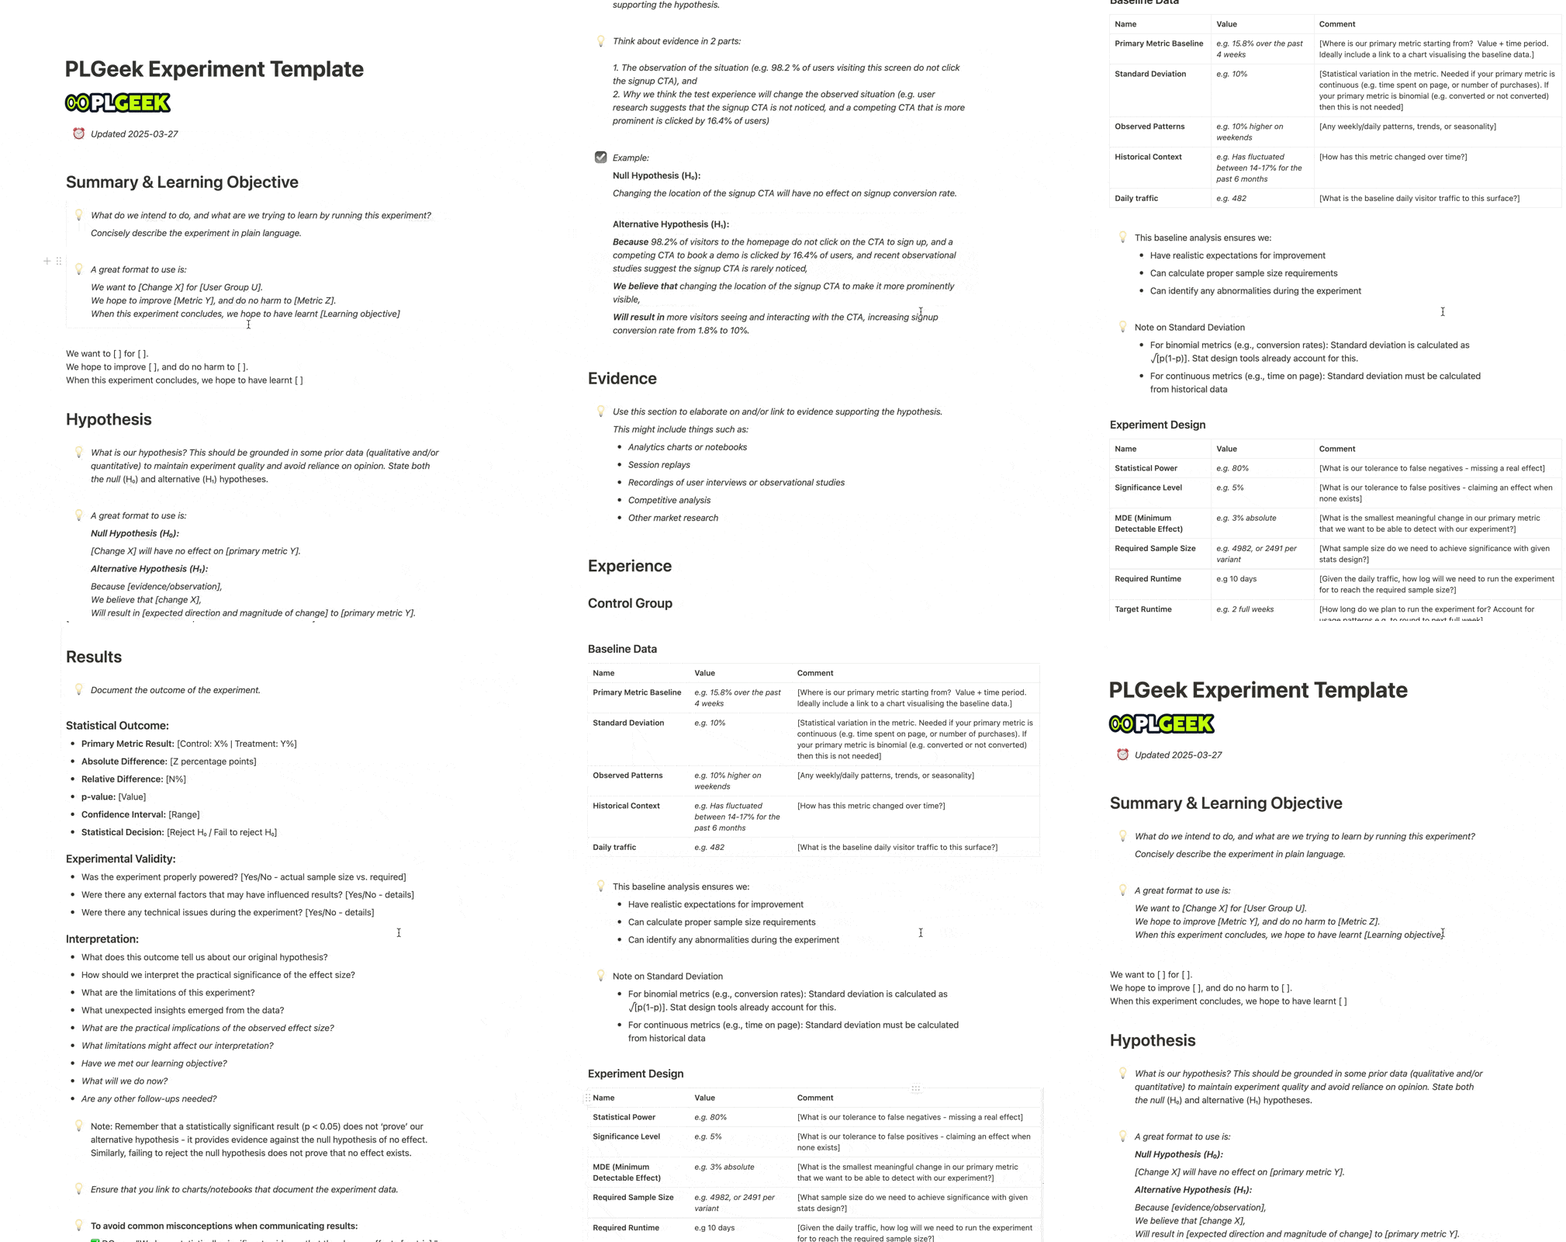
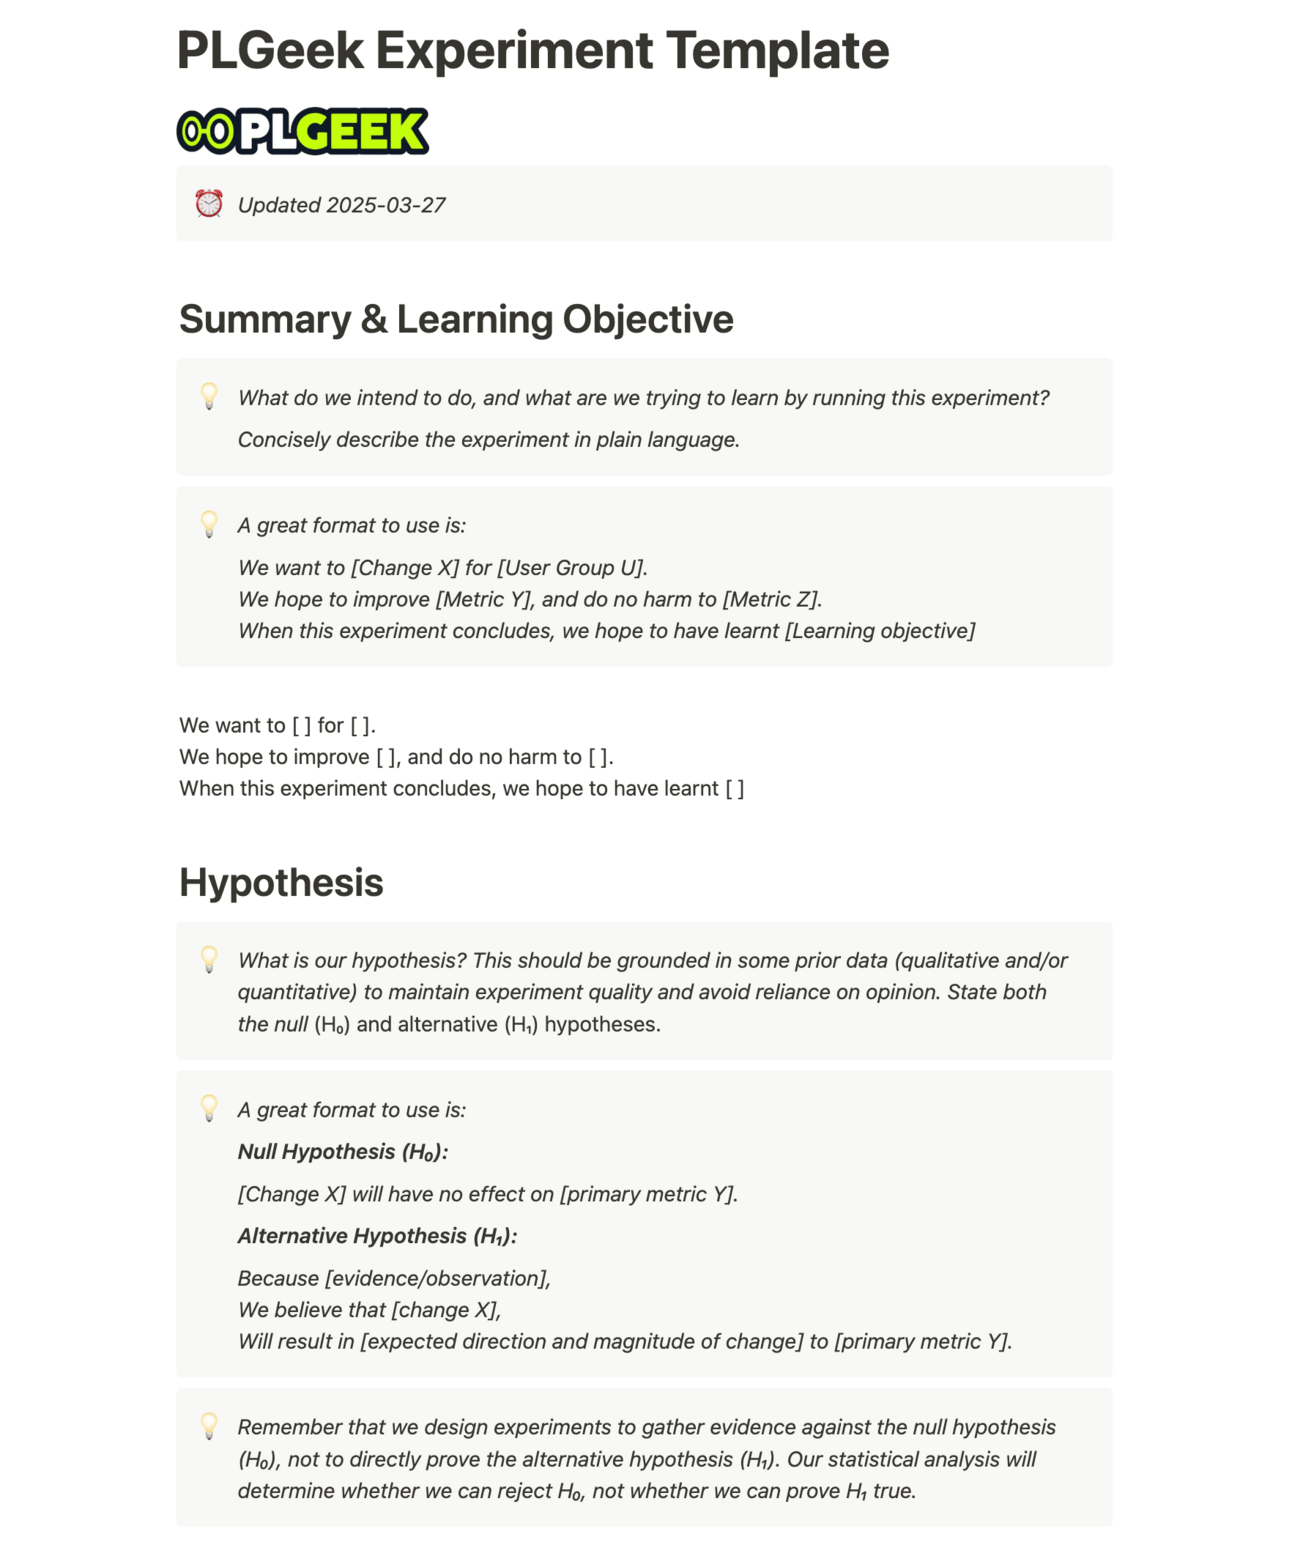
PS: Get the full Notion template below - feel free to duplicate it and use as you wish!
📝 GEEK TEMPLATE
Click here or on the image above to get the template.
😂 GEEK GIGGLE
💪 POWER UP
If you enjoyed this post, consider upgrading to a VIG Membership to get the full Product-Led Geek experience and access to every post in the archive including all guides. 🧠
THAT’S A WRAP
Before you go, here are 2 ways I can help:
Book a free 1:1 consultation call with me - I keep a handful of slots open each week for founders and product growth leaders to explore working together and get some free advice along the way. Book a call.
Sponsor this newsletter - Reach over 7500 founders, leaders and operators working in product and growth at some of the world’s best tech companies including Paypal, Adobe, Canva, Miro, Amplitude, Google, Meta, Tailscale, Twilio and Salesforce.

That’s all for today,
If there are any product, growth or leadership topics that you’d like me to write about, just hit reply to this email or leave a comment and let me know!
Until next time!
— Ben

Rate this post (one click)
PS: Thanks again to our sponsor: Dovetail


