- The Product-Led Geek
- Posts
- 👓 Understand This Concept To Make Better Product & Growth Decisions (Part 2)
👓 Understand This Concept To Make Better Product & Growth Decisions (Part 2)
Ben Williams
April 15th, 2025
Welcome folks! 👋
This edition of The Product-Led Geek will take 10 minutes to read and you’ll learn:
DEPERH: A systematic 6-step method to design, execute and interpret experiments that deliver reliable product insights.
How to avoid the four biggest misconceptions about statistical significance that lead even experienced teams to make costly product mistakes.
How to transform your experimentation culture with practical tools including standardised hypothesis templates, review protocols and decision logs.
Let’s go!

TOGETHER WITH INFLECTION.IO
Downloadable File: Customer Lifecycle Journey of Canva
Everyone knows Canva is one of the hottest PLG companies.
They have over $2B in ARR and even at 8000 employees they are growing headcount more than 70% in the last 2 years (when everyone else is doing layoffs).
We wanted to learn their secrets, so spent over 20 hours doing a lifecycle marketing review. We’ve prepared a Figma file with the complete customer lifecycle journey of Canva and we are giving it away for free!

Please support our sponsors!
GEEK LINKS
3 interesting, amusing, or enlightening links
1. Every Marketing Channel Sucks Right Now
2. The Art and Science of Good Decisions: Balancing Instinct and Data
3. 5 interesting learnings from Revenue per Engineer data at 300+ companies
GEEK OUT
Understand This Concept To Make Better Product & Growth Decisions (Part 2) - Practical Applications for Better Product Decisions
In Part 1 of this series, we explored the fundamental concept of the null hypothesis and why it forms the foundation of effective experimentation. We covered:
Why we start with the assumption of "no effect"
How p-values help us decide when evidence is strong enough
The importance of setting appropriate significance levels
Now it's time to translate that understanding into practical tools you can use to make better product decisions. Let's dive into the frameworks, common pitfalls, and real-world applications that will transform your approach to experimentation.
DEPERH (Define, Establish, Posit, Execute, Reject, Handle)
Taking the principles covered in Part 1 of this series, here’s a practical framework for product teams to properly implement hypothesis testing.
The acronym is DEPERH (I pronounce it "deeper"), and it helps avoid common pitfalls.
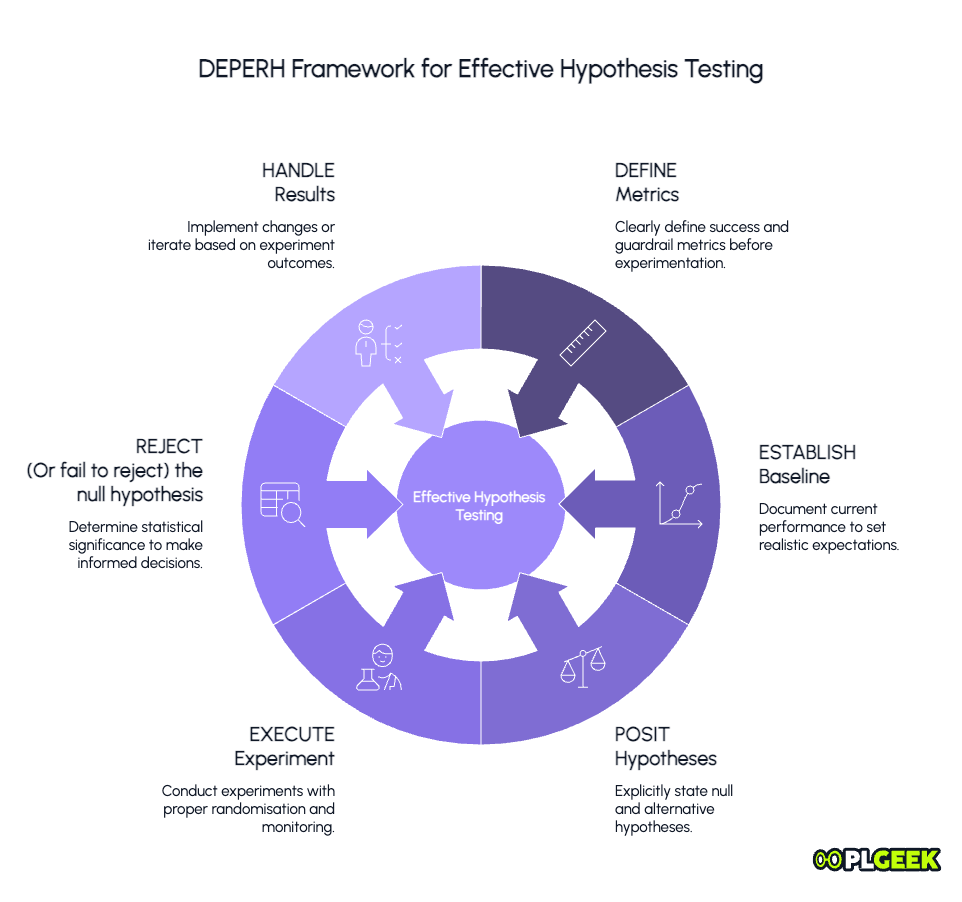
1. Define your metrics precisely
Before any experimentation, clearly define:
Primary success metric: The one metric that will determine success/failure
Guardrail metrics: Metrics that must not significantly deteriorate
Monitoring metrics: Additional metrics to track for insights
Bad example: We want to improve engagement.
Good example: We will measure success by 7-day retention rate, while ensuring conversion rate doesn't drop more than 2% and load time remains under 1.5 seconds.
2. Establish your baseline
Document current performance before making any changes:
Collect sufficient pre-experiment data (at least 2-3 weeks if possible)
Note any existing patterns or trends in your metrics
Calculate standard deviations to understand normal fluctuations
This baseline data helps you:
Set realistic expectations for improvement
Ensure your experiment has adequate statistical power
Identify any seasonal effects that might influence results
3. Posit both hypotheses explicitly
Always clearly state both hypotheses:
Null Hypothesis (H₀): The change will have no effect on [primary metric].
Alternative Hypothesis (H₁): The change will [increase/decrease] [primary metric].
Include expected effect size and direction in your alternative hypothesis:
Weak: The new onboarding flow will improve conversion.
Strong: The new onboarding flow will increase 7-day activation rate by 15% ± 5%.
4. Execute your experiment
Running a clean, reliable experiment requires careful implementation:
Randomise properly: Ensure users are randomly assigned to variants using consistent methods
Calculate adequate sample size: Based on your minimum detectable effect and significance threshold
Determine appropriate duration: Run the test long enough to capture weekly cycles and behavioural patterns
Implement proper instrumentation: Confirm all necessary events are tracked before launching
Monitor in real-time: Watch for technical issues or unexpected behaviour without peeking at results
Prevent contamination: Maintain clean separation between control and test groups throughout the experiment
5. Reject (or fail to reject) based on data
Once your experiment concludes:
Calculate statistical significance (p-value) for your primary metric
Compare against your predetermined significance level (usually 0.05)
Make a crisp decision: reject H₀ or fail to reject H₀
Avoid ambiguous language like ‘somewhat significant’ or ‘trending positive’
6. Handle results appropriately
Based on the statistical outcome:
If you reject H₀ (p < 0.05):
Implement the winning variant
Document learnings and extend to similar areas of the product
Consider follow-up experiments to optimise further
If you fail to reject H₀ (p ≥ 0.05):
Don't implement the change based on your primary metric
Check if the experiment had sufficient power (sample size)
Look for insights from segments or secondary metrics
Consider iteration or a different approach
Four Common Misconceptions That Lead to Bad Product Decisions
Over the years running product and growth experiments, I've seen the a few misunderstandings lead to poor decisions again and again.
Here are some of the more dangerous misconceptions about hypothesis testing, and how to avoid them:
Misconception 1: Statistical significance means we've proven our hypothesis
When a test achieves statistical significance (p < 0.05), many product managers triumphantly declare, "We've proven our hypothesis!" But this is fundamentally incorrect.
Reality: Statistical significance doesn't prove your alternative hypothesis. It only indicates that the observed data would be unlikely if the null hypothesis were true.
We never ‘prove’ the alternative hypothesis. We gather evidence against the null. This distinction matters because it keeps us appropriately humble about our findings and open to further testing.
❌ Instead of saying: "We've proven that the red button works better."
✅ Say: "We have statistically significant evidence that the button colour affects conversion rates."
Misconception 2: No statistical significance means no effect exists
When a test fails to reach statistical significance, teams often conclude, "There's no difference between the variants." This is just as wrong as the first misconception.
Reality: Failing to reject the null hypothesis doesn't prove the null hypothesis. It simply means you didn't collect enough evidence to confidently reject it. The effect might:
Be smaller than you can detect with your sample size
Exist only in certain segments of your user base
Take longer to manifest than your test duration
❌ Instead of saying: "The new feature has no effect on retention."
✅ Say: "We did not find statistically significant evidence that the new feature affects retention."
Misconception 3: A p-value of 0.04 means there's a 96% chance our feature works
This misunderstanding is particularly pernicious because it sounds logical but is completely backwards.
Reality: The p-value is not the probability that your alternative hypothesis is true. A p-value of 0.04 means:
If the null hypothesis were true (i.e., if there actually is no difference between variants), there's a 4% chance of seeing results at least this extreme by random chance.
Put differently, a p-value of 0.04 tells you about the probability of your data assuming the null hypothesis, not about the probability of the null hypothesis given your data.
❌ Instead of saying: "We're 96% confident the feature works."
✅ Say: "The observed difference would be unlikely (4% probability) if the feature truly had no effect."
Misconception 4: Statistical significance means the effect is meaningful
Many teams celebrate a statistically significant result without considering the actual effect size.
Reality: With a large enough sample size, even tiny, practically meaningless differences can become statistically significant. What matters is both:
Statistical significance (confidence the effect is real)
Practical significance (the effect size is large enough to matter)
A 0.1% conversion improvement might be statistically significant with millions of users, but might not justify the engineering cost to implement. Conversely, a 20% improvement that narrowly misses statistical significance might warrant further investigation.
❌ Instead of saying: "The test is significant, so we should launch."
✅ Say: "We're confident the effect is real, and the 12% improvement justifies the implementation cost."
Example
Let's examine a scenario that demonstrates how proper hypothesis testing principles leads to better product decisions.
Consider a SaaS app testing a streamlined onboarding flow designed to increase completion rates. The test results show:
Completion rate: +12% (p = 0.03) ✅
30-day retention: -6% (p = 0.06) ❌
Free to paid conversion rate: -7% (p = 0.09) ❌
Possible reactions:
The Primary Metric Only Approach: "Our primary metric shows statistical significance with a strong positive effect. The other metrics didn't reach significance at our threshold, so we should launch immediately."
The Conservative Approach: "The negative trends in our guardrail metrics are concerning, even if they don't quite reach significance. Let's reject this change entirely."
The Balanced Approach: "While our primary metric improved significantly, the concerning trends in critical business metrics suggest we shouldn't launch this version. However, the completion rate improvement indicates we're onto something valuable. Let's do some further research and iterate on the design to try to maintain the completion benefits while addressing the potential negative effects."
The optimal approach is of course the third option. Applying proper hypothesis testing principles means:
Recognising that failing to reject H₀ for the negative effects doesn't prove they aren't real
Acknowledging that guardrail metrics are crucial to long-term business health
Iterating on the design rather than making a binary launch/abandon decision
In such a scenario, a revised design might ultimately deliver:
Completion rate: +14% (p = 0.02) ✅
30-day retention: +2% (p = 0.41) ✅
Free to paid conversion rate: +1% (p = 0.37) ✅
By understanding the proper role of hypothesis testing, you can avoid potentially costly mistakes while still capitalising on promising discoveries.
The key is remaining open to iteration rather than forcing an all-or-nothing decision based on a single test.
Putting It All Together: Your Action Plan for Better Experiment Design
To implement these principles in your own experimentation program:
1. Create a standardised hypothesis template
Ensure that all experiments include:
Null Hypothesis (H₀): [Change X] will have no effect on [metric Y].
Alternative Hypothesis (H₁): [Change X] will [increase/decrease] [metric Y] by [expected effect size].
Evidence: Specific quantitative and/or qualitative data that informs the hypothesis.
Primary Success Metric: Specific metric with precise definition.
Guardrail Metrics: Metrics that must not deteriorate.
Monitoring Metrics: Additional metrics to track for insights.
Significance Level (α): Typically 0.05.
Minimum Detectable Effect: Smallest effect size worth detecting.
Required Sample Size: Calculated based on above parameters.
Check out this post for my guide on writing a great experiment plan (with a complete template you can steal):

2. Establish an experiment review protocol
For each experiment conclusion:
Was the experiment properly powered? (sufficient sample size)
Did we observe any unexpected patterns in the data?
What is our confidence level in rejecting/failing to reject H₀?
What are the practical implications of the observed effect size?
What limitations might affect our interpretation?
3. Maintain an experiment decision log
For each test, document:
The experimental design and hypotheses
The results (both statistical and practical significance)
The decision made and reasoning
Unexpected insights or learnings
Follow-up questions or future experiments
This log becomes an invaluable resource for training new team members and improving your experimentation practice over time.
4. Train your team on hypothesis testing fundamentals
Ensure everyone involved in experimentation understands:
Why we try to disprove the null hypothesis rather than prove the alternative
The correct interpretation of p-values and statistical significance
The difference between statistical and practical significance
Common pitfalls like p-hacking, multiple comparisons, and underpowered tests
From Theory to Practice
In Part 1 of this series, I covered why the null hypothesis framework is foundational to effective experimentation. Now, with these practical tools in hand, you're ready to apply this to enable your team to make better product decisions.
The DEPERH framework gives you a structured approach to design experiments that deliver reliable insights. Understanding common misconceptions helps you avoid the traps that lead to poor decisions. And maintaining rigorous documentation ensures your team learns and improves with each experiment.
The end goal isn't perfect experimental design - it's better product decisions. By adopting this scientific mindset, you'll:
Ship fewer features that don't work
Identify more opportunities that drive real growth
Build greater confidence in your decisions
Create a culture of evidence-based thinking
The humble, careful approach of rejecting the null hypothesis rather than proving our ideas might seem less satisfying in the moment. But it leads to products that genuinely serve users better and businesses that grow more sustainably.
What experiments are you running now? How might reframing them through the null hypothesis lens change your approach? I'd love to hear your thoughts and experiences in the comments - or just drop me a email: [email protected]
Enjoying this content? Subscribe to get every post direct to your inbox!
THAT’S A WRAP
Before you go, here are 3 ways I can help:
Take the FREE Learning Velocity Index assessment - Discover how your team's ability to learn and leverage learnings stacks up in the product-led world. Takes 2 minutes and you get free advice.
Book a free 1:1 consultation call with me - I keep a handful of slots open each week for founders and product growth leaders to explore working together and get some free advice along the way. Book a call.
Sponsor this newsletter - Reach over 7600 founders, leaders and operators working in product and growth at some of the world’s best tech companies including Paypal, Adobe, Canva, Miro, Amplitude, Google, Meta, Tailscale, Twilio and Salesforce.
That’s all for today,
If there are any product, growth or leadership topics that you’d like me to write about, just hit reply to this email or leave a comment and let me know!
And if you enjoyed this post, consider upgrading to a VIG Membership to get the full Product-Led Geek experience and access to every post in the archive including all guides.
Until next time!
— Ben
RATE THIS POST (1 CLICK - DON'T BE SHY!)Your feedback helps me improve my content |
PS: Thanks again to our sponsor: Inflection.io
Reply